
Industries · IPPs, hybrid park operators, O&M providers
predictive maintenance for renewable fleets
Alarm floods without foresight; performance loss hidden in averages; BESS thermal and state-of-health risk.
02 · IPPs, hybrid park operators, O&M providers
Wind, solar & storage
Alarm floods without foresight; performance loss hidden in averages; BESS thermal and state-of-health risk.
Modules
Fleet Health3D Site TwinInsights & ROIWork OrdersPlayback
Equipment classes
WindTurbinePhotovoltaicUnitBatteryUnitPowerTransformerInverter collector cables
Reference twins
- Khavda Hybrid RE Park — PS-4 · Gujarat15 MW wind · 5.5 MWdc PV · 10 MW/20 MWh BESS · 45 MW peaker · 400 kV pooling
- Bhadla Solar Park — Block 7 · Rajasthan4 × 3 MWdc bifacial trackers · 33/220 kV pooling
Use case · Catch a gearbox before it takes a turbine down
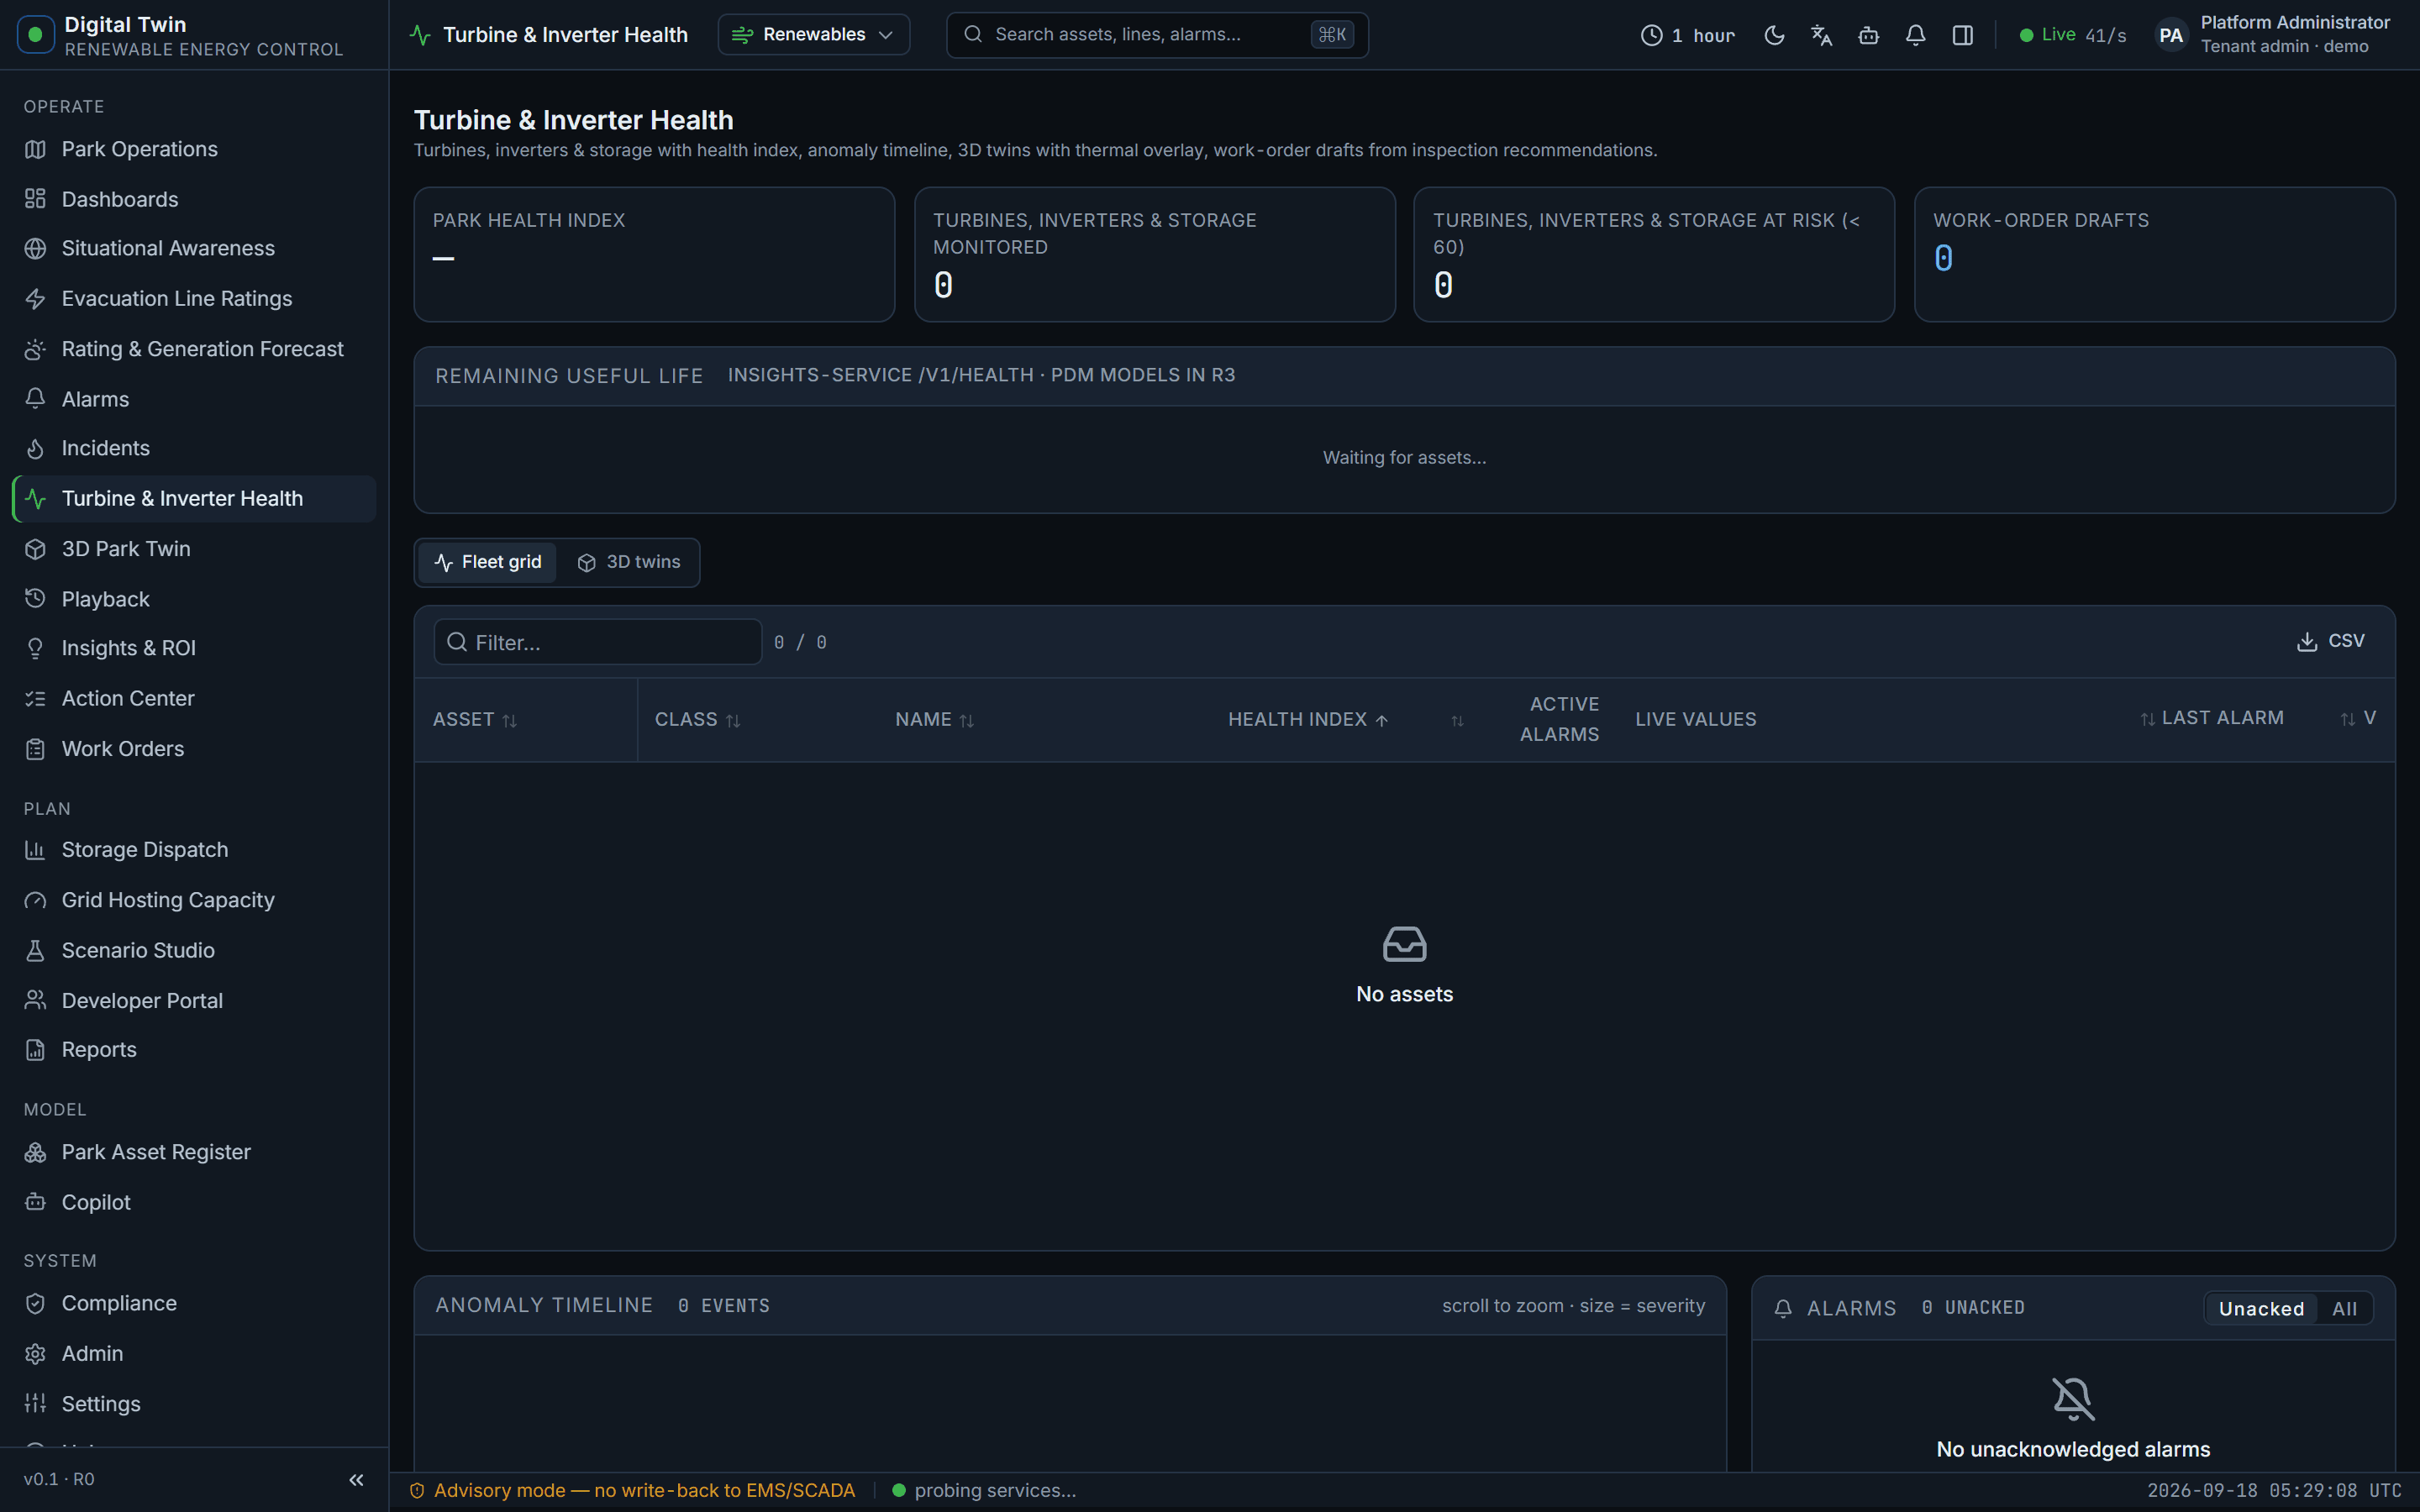
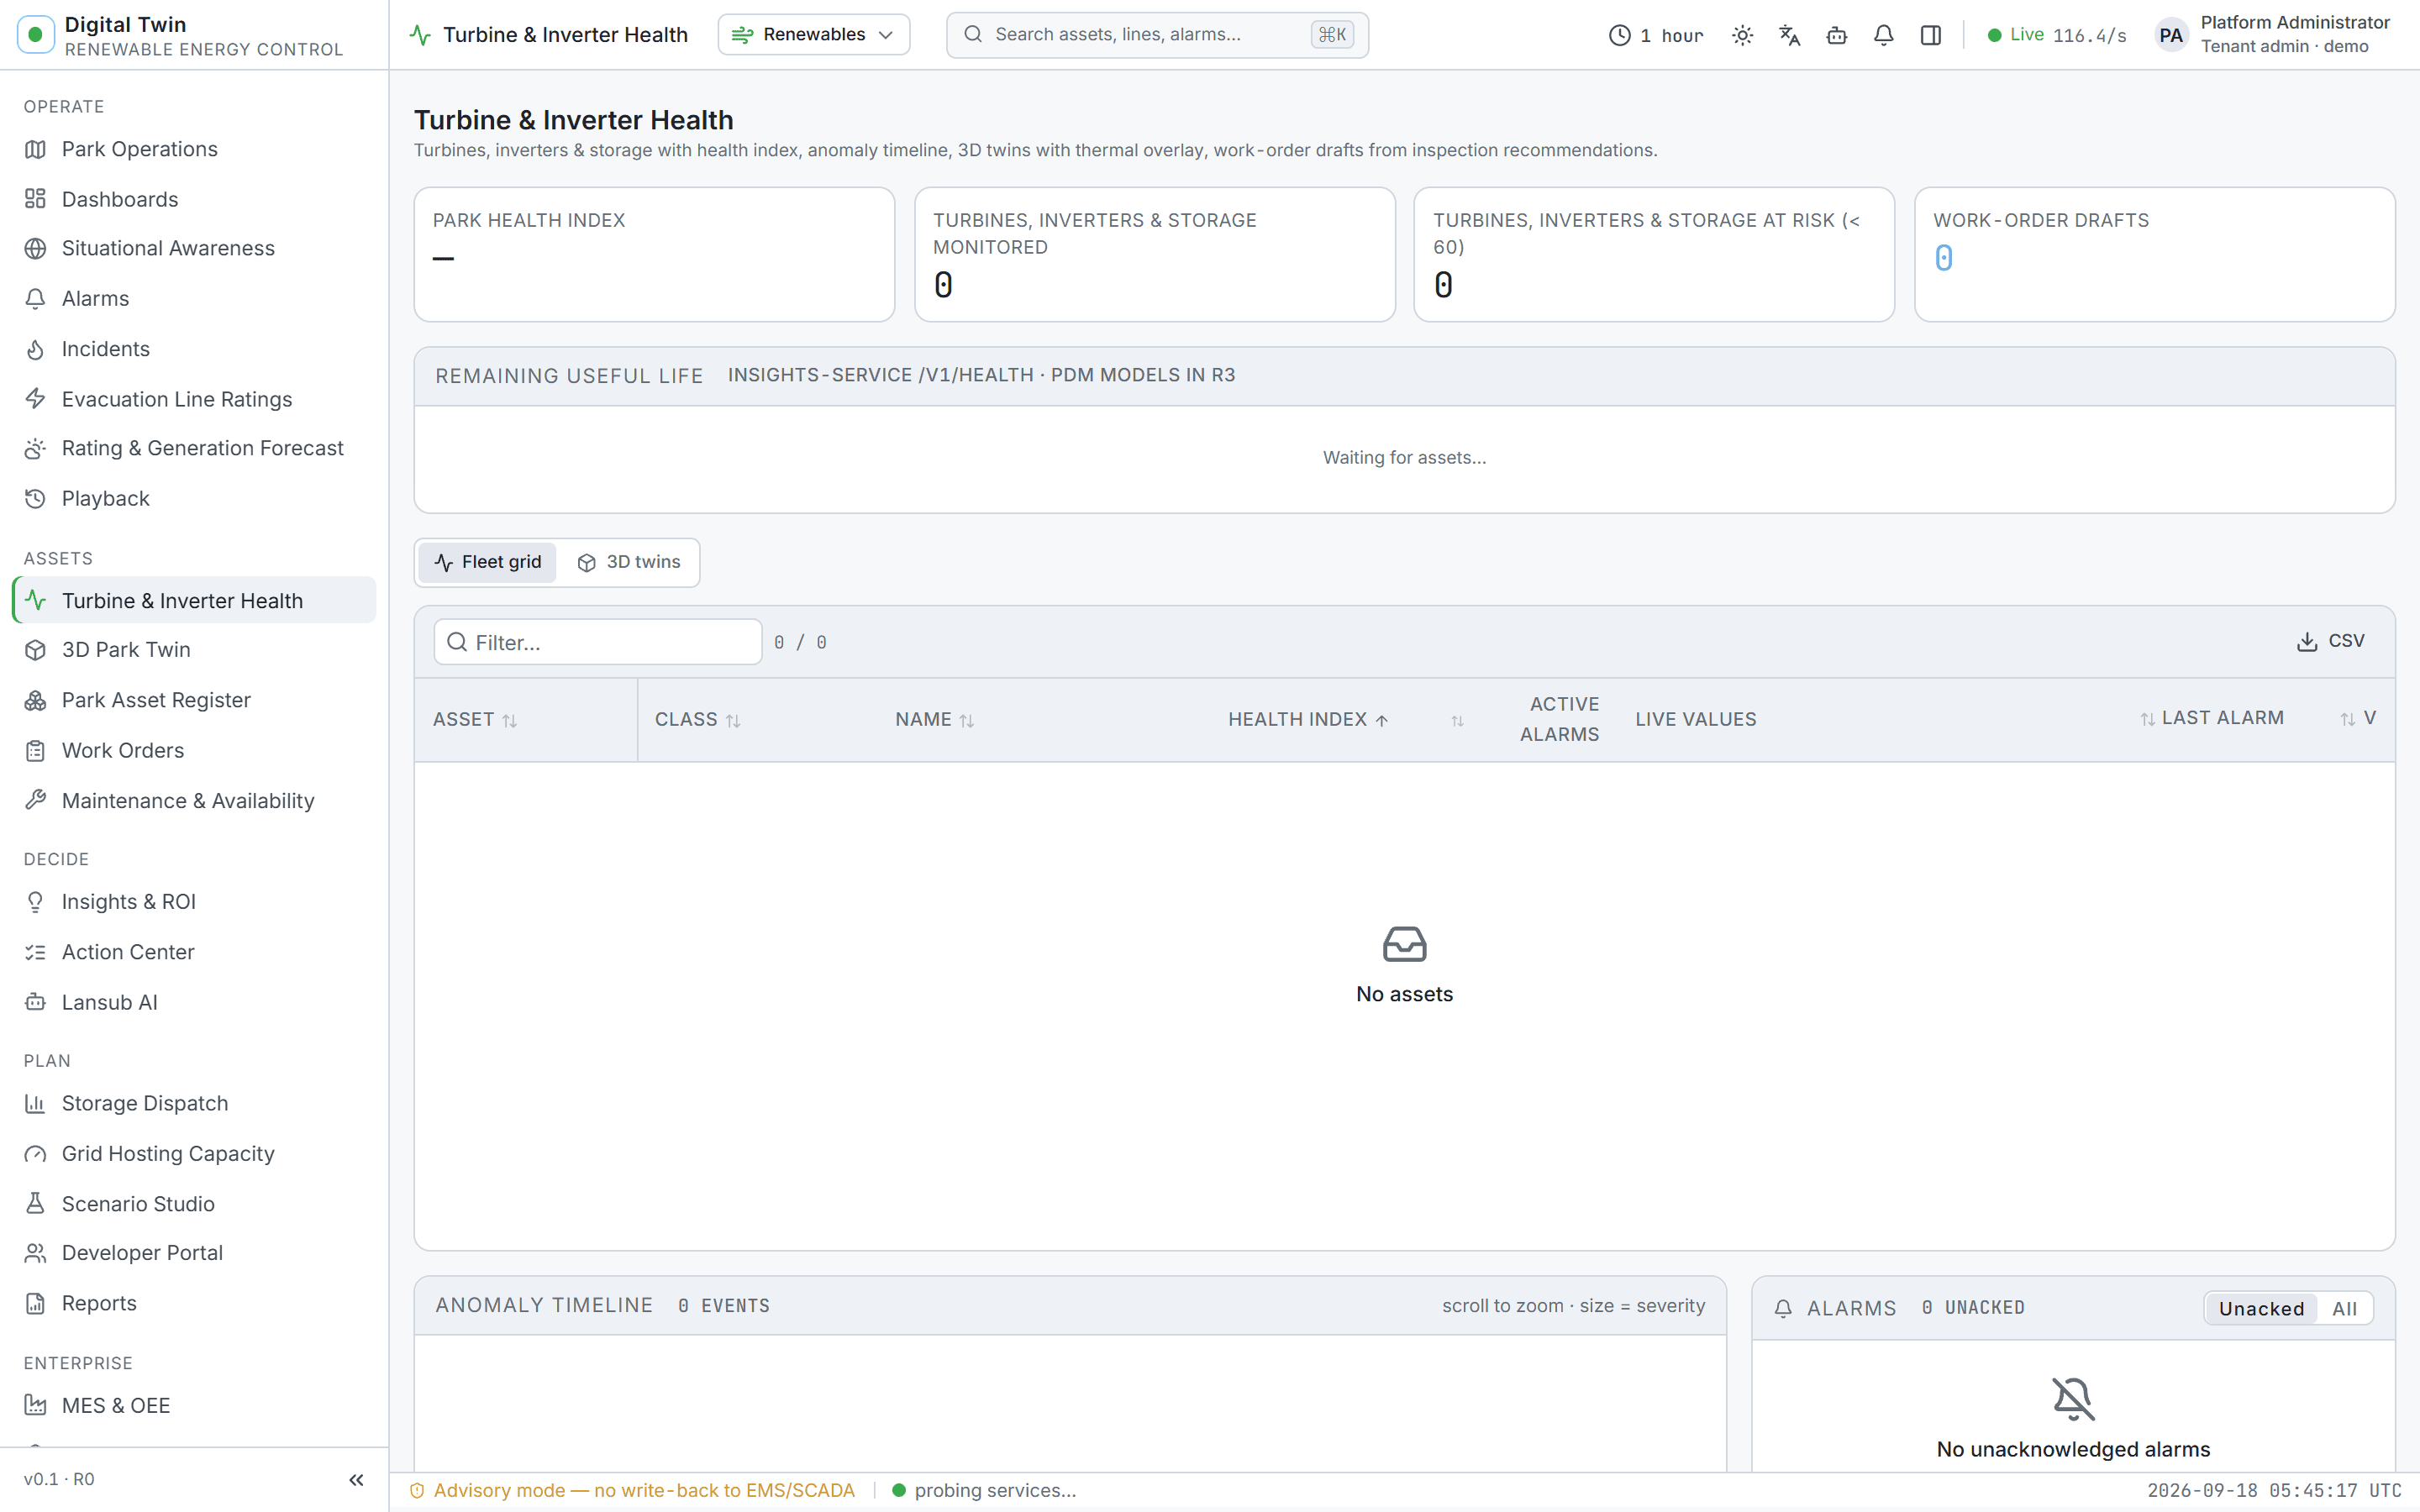
- 1Nacelle, gearbox and generator telemetry from the park SCADA streams into the twin.
- 2The physics engine compares output against the IEC 61400-12 power curve; health scoring applies ISO 10816 vibration zones.
- 3A streaming z-score anomaly on gearbox_temp_c triggers an INSPECTION recommendation (confidence 0.6+) with the expected avoided cost.
- 4A work order is created and dispatched to the site crew; the 3D twin shows the exact turbine and sensor.
- 5Closure and findings are recorded; the fleet health index and RUL update for the whole class.
Reference: 25% less downtime and up to 5-year life extension with fleet predictive maintenance.
Why it pays
What changes for your team
- IEC 61400-12 power-curve and ISO 10816 vibration baselines out of the box
- Work orders drafted from anomalies with expected avoided cost
- BESS thermal and state-of-health risk on the same screen as production
Case study · reference twin
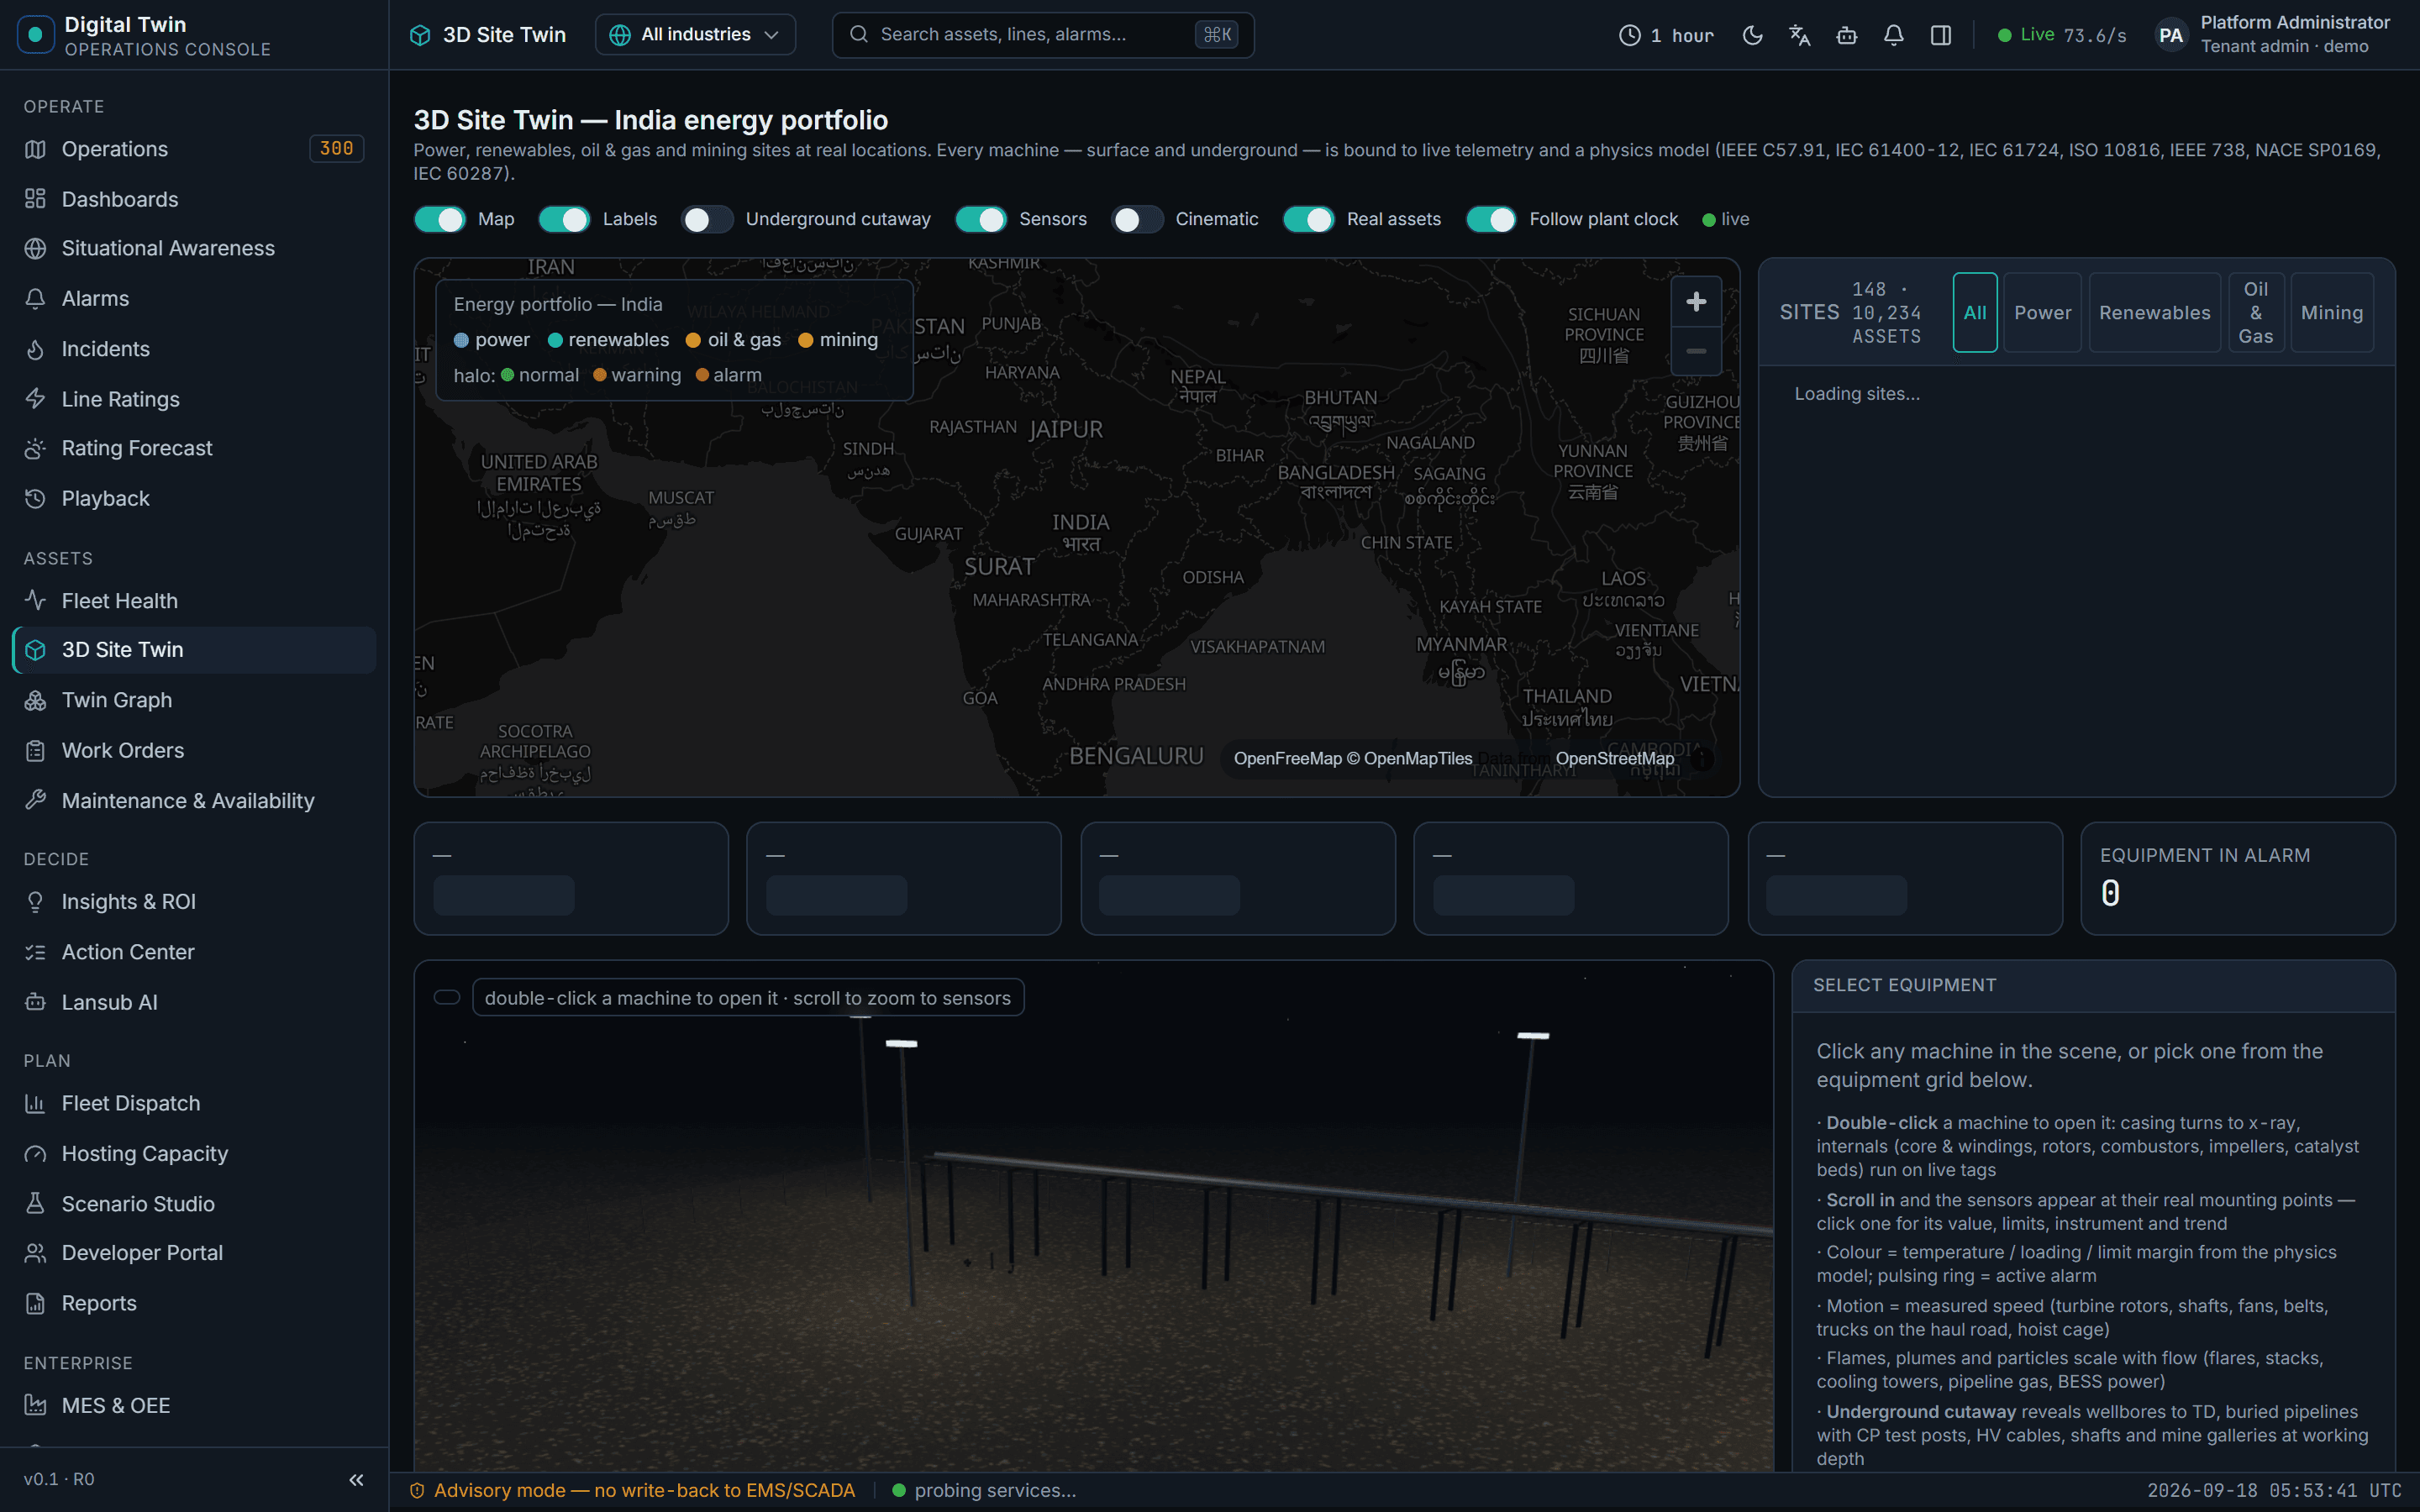
Reference deployment · Khavda wind fleet gearbox save
Six 2.5 MW turbines; one gearbox develops a bearing temperature anomaly that averages hide — the park SCADA shows normal production.
- Streaming z-score on gearbox_temp_c flags the deviation against the IEC 61400-12 baseline
- INSPECTION recommendation with expected avoided cost; work order dispatched to the site crew
- 3D twin pinpoints the turbine and sensor; closure updates fleet RUL for the class
Runs end-to-end on the Khavda Hybrid RE Park — PS-4 reference twin (Gujarat) — real geography and plant configuration, synthetic telemetry. Reproduce every number in the live demo.
Implementation
Live in 90 days, advisory-first.
Read-only: park SCADA (OPC UA / IEC 61400-25 exports / historian), OEM tag lists mapped in the review queue, market or PPA prices for value booking.
Weeks 1–3 · Connect
Park SCADA connected read-only; turbines, inverters and BESS racks auto-mapped from tag names with human review.
Exit · Fleet visible with live health colouring
Weeks 4–8 · Model & baseline
IEC 61400-12 power curves and ISO 10816 vibration baselines per asset; anomaly thresholds tuned against O&M history.
Exit · Baseline report; first confirmed anomalies
Weeks 9–12 · Advisory live
Anomaly → recommendation → work-order flow live with your O&M provider; avoided-cost booking per closed work order.
Exit · Precision review with O&M; realised-value ledger
Value & ROI
Estimate your case — wind, solar & storage numbers only.
Defaults below are the reference figures for this industry; drag the sliders to your fleet. The full calculator with every industry is on the Value & ROI page.
Recovered production (performance & curtailment)
Avoided downtime (turbines, inverters, BESS)
Illustrative annual value
- Energy recovered
- 8 MW avg
- USD 672,000 / yr
- Outage hours avoided
- 1,152 h
- USD 1.38 M / yr
- Total
- USD 2.05 M
- per year, before subscription
Anomaly-to-work-order flow drafts the intervention with expected avoided cost; realised value is booked when the work order closes. The 90-day pilot replaces every assumption here with measured numbers from your telemetry and recommendations marked realized.
See it running on the reference twins — or on a sanitised slice of your own telemetry. Try the live SCADA & 3D demo
Request a demoSee Digital Twin on your own network data.
A 45-minute working session with our grid engineers on a sanitised slice of your topology and telemetry, followed by a scoped 90-day pilot proposal.